The Beginning
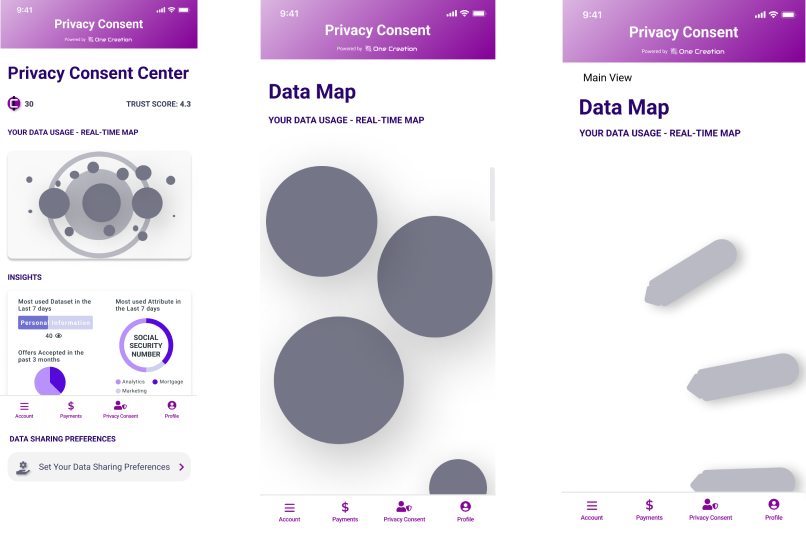
Since 2019 One creation has been protecting the data of privacy lovers. Unfortunately, user retention has been a problem due to the complicated data map that shows all datasets in one place (YIKES!). In my role as UX designer, I helped my team develop a research-informed design decision that makes data visualization simple, digestible and tangible. This allows anyone without prior data knowledge to use One creations dashboard and embedded mobile application. One Creation enables data protection by giving the control of data privacy directly to me and you - the data owners. Within each user’s data privacy dashboard, there is an interactive map. This is meant to serve as an end-to-end data lineage tracking tool.
WHAT: Embedded Data Privacy
ROLE: Product Designer
TEAM: Mara Maeglin, Kai Hara, Mair Ahmad
METHODS: User Research, Business Research, Competitive + Comparative analysis, Affinity Mapping, Persona Building, Feature Prioritization, Wireframing, Prototyping, High Fidelity Mockups, Usability Testing
TOOLS: Figma, FigJam, Whimsical
“Privacy! (to the people)”
This is the exciting story of how my team and I were tasked with a data lineage map and re-designed a brand new interactive map that can help organizations monetize their data.
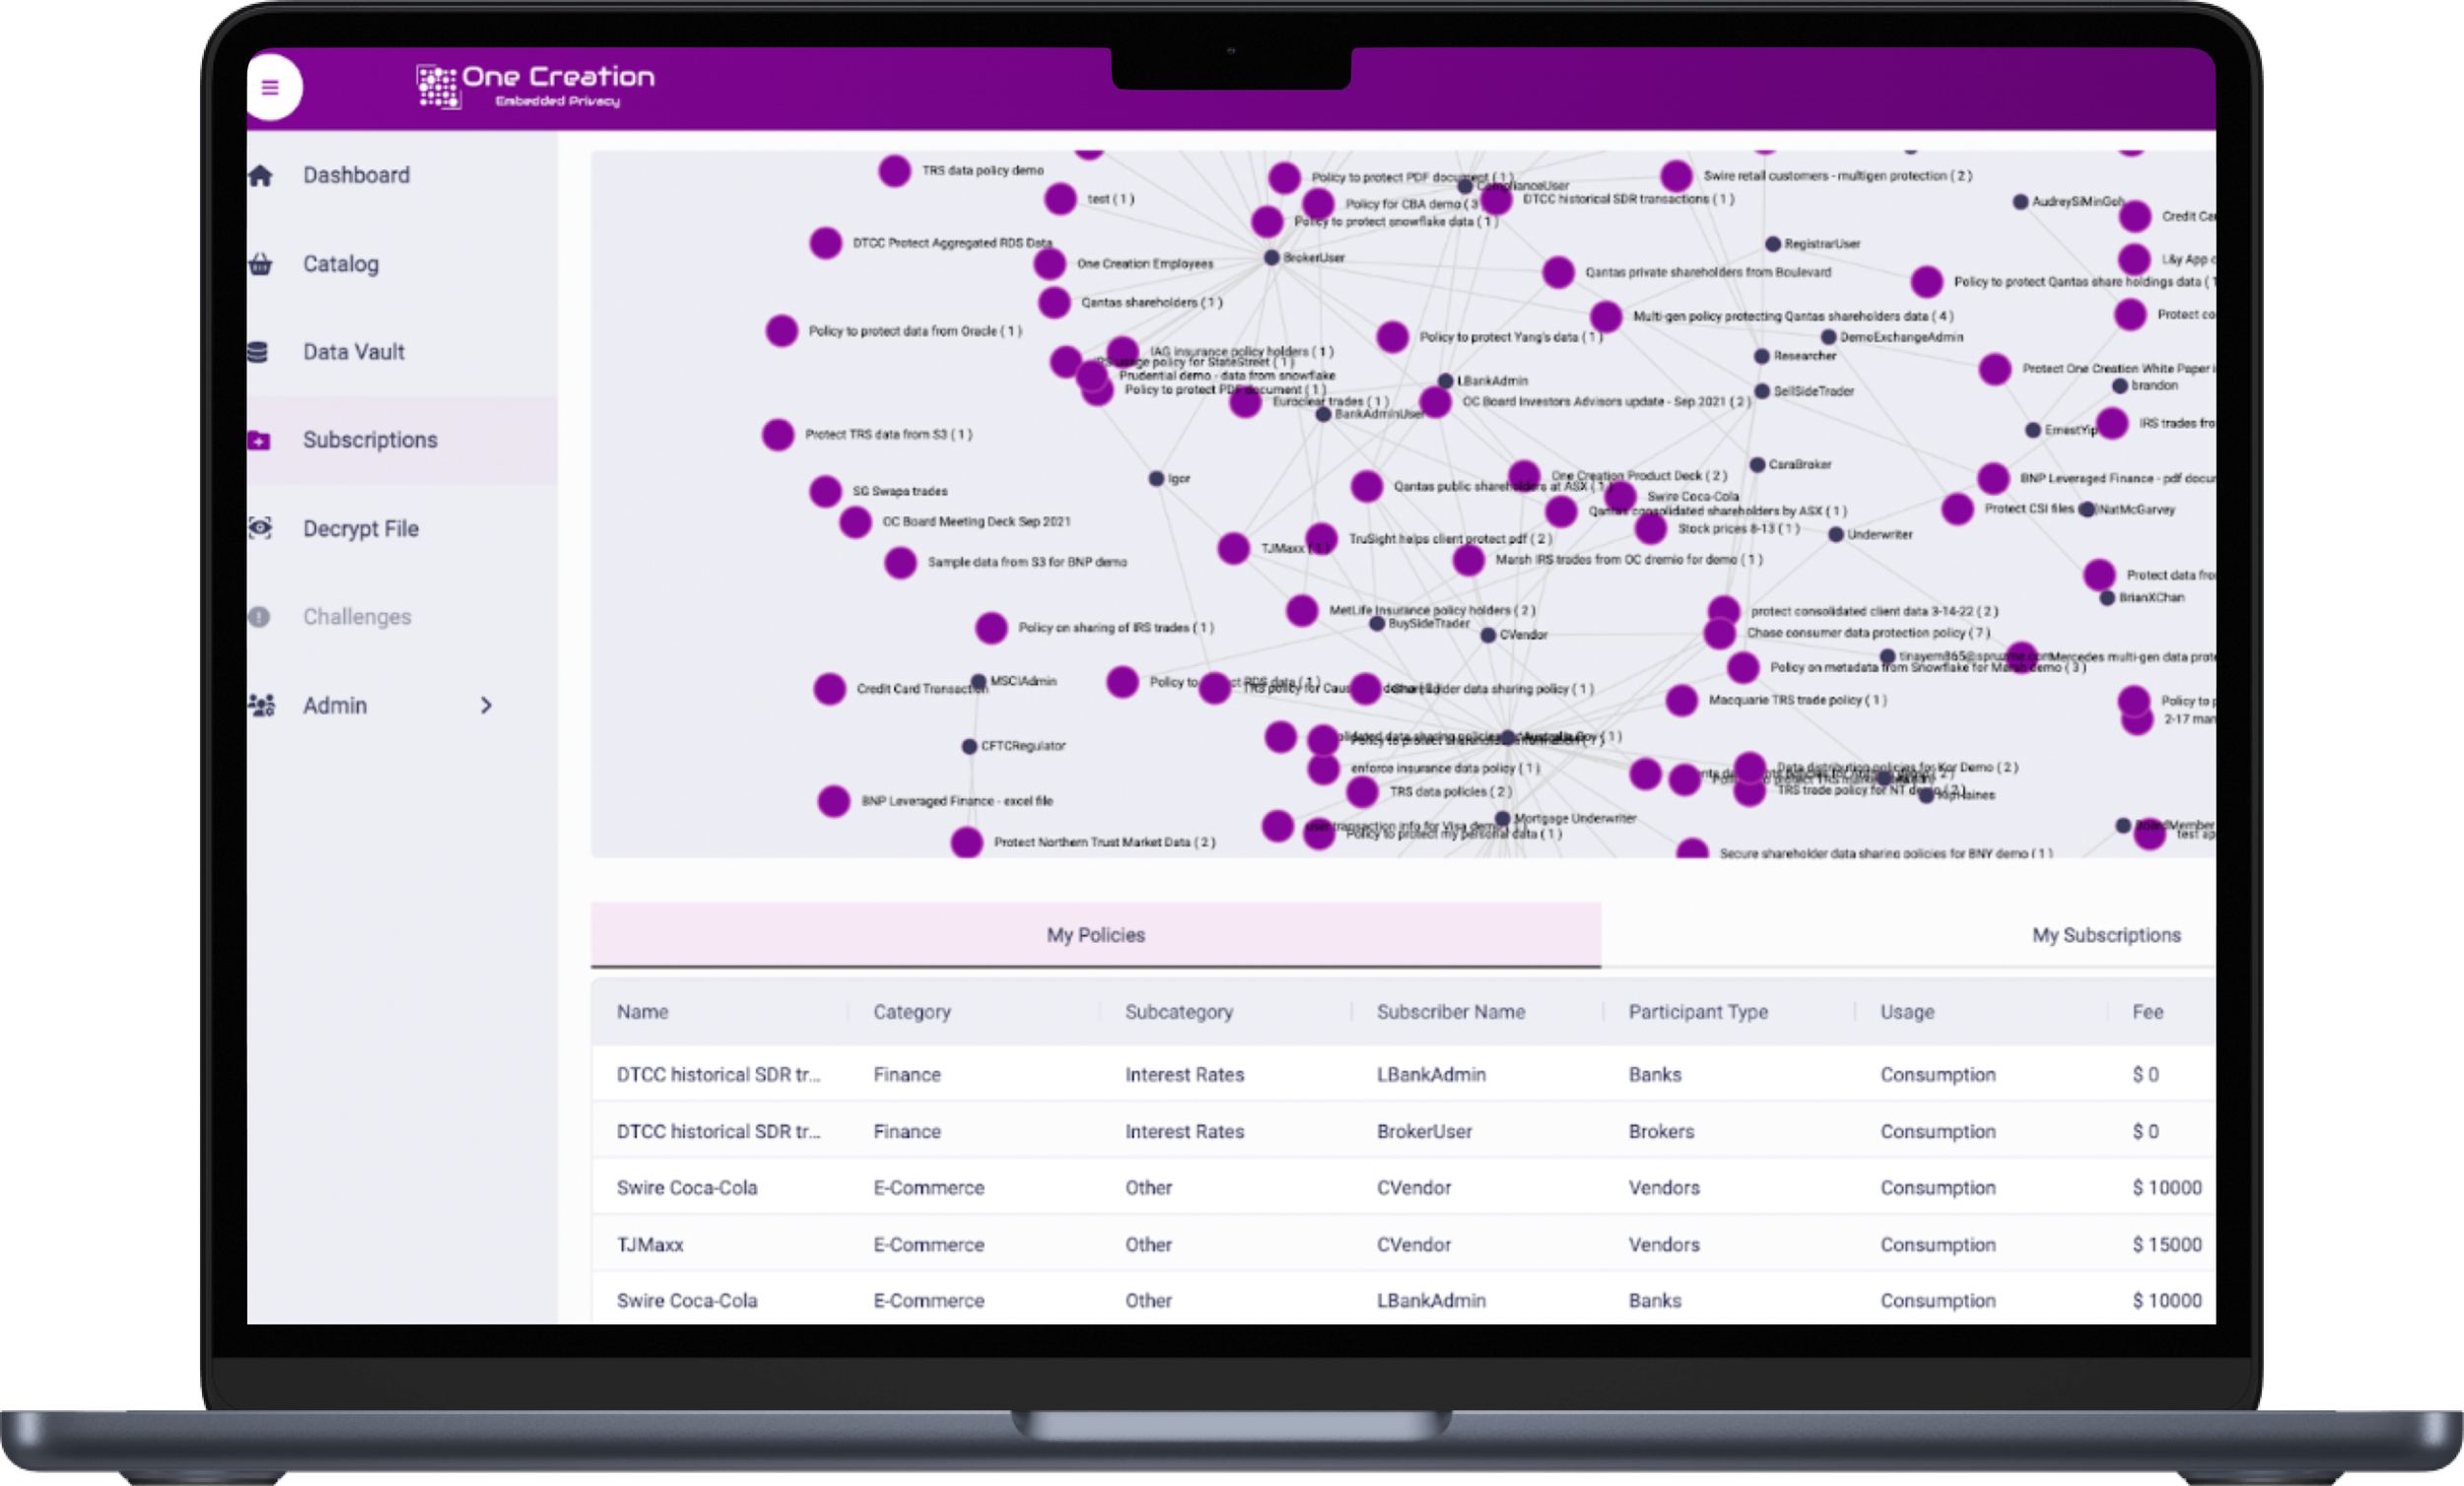
Original site
Approach
We struggled, but we found a way out.
We shifted our normal practice of the design thinking process to be more RESEARCH focused.
We spent an extensive amount of time to study the company and the product itself.
We asked a lot of questions.
Then, we focused on identifying user needs, pinpointing user frustrations, and aligning business goals with the client and stakeholders.
This process helped to build the foundation of our knowledge in this product and eventually led to a successful design with great feedback.
THE PROBLEM
One Creation Data Lineage Map is a dynamic and easy-to-use interface that offers a solution for privacy preservation, bringing transparency and awareness to data sharing and and digital rights for enterprise and individual users alike.
By offering transparency, individual mobile users have clarity on and control over the full life-cycle of their data, and enterprise desktop users have a way to ethically distribute and monetize data.
The transparency helps both users develop insights that support informed decision-making and facilitates trust and confidence in the data privacy industry.
Competitive/comparative analysis
We were all shocked to learn our existing interaction with data privacy is in our daily lives, but we don’t realize it. Every-time you open a webpage you’re asked if you would like to accept or decline cookies. Research suggests that when people are asked about their data privacy it’s very important to them, However, the actual behavior of people is oblivious to the fact that accepting cookies means you are sharing your data, without having the choice to choose what you are sharing.
Through competitive/comparative analysis we found that One Creation is one of the only companies who is trying to visualize their data in an interactive way. The goal is to understand how users from other platforms interact with their data tracking and provide protection around data sharing.
We identified the limitation, or even lacking, of the data tracking visualization across the data privacy industry.


User research
After realizing how complex data visualization can be, we decided to explore research and interview people about how they share their data, if at all.
Our group developed a survey that received 14 responses and we also conducted user interviews with 6 additional participants. The survey included a mix of closed and open ended questions regarding privacy behaviors and users’ understanding of information privacy and data tracking. The user interviews also include a portion of usability testing where we tested the original data lineage map with participants from various backgrounds.
We also did a MSCW activity on our Task flow where we identified what elements needed to be included for each page.

two Goals for Desktop Users:

four Goals for Mobile Users:


Trends
1. Half of participants mentioned that the map lacks flow, hierarchy, and organization.
“I have no idea where I am starting with this map”

2. 50% of the participants mentioned that the map lacks guidance and explanation throughout the process which eventually leads to confusion. As 50% of the participants mentioned that they were confused and overwhelmed by the map.

3. The doubt around how this map can be applied to a big dataset and how user friendly it is for users without a data background.
Ideation
How might we…
Prevent human error in our design?
Prioritize features?
How might we best demonstrate the map's interactive features in a static design?
How might we show users which elements are most important?
Sketches

Wireframes
We had to keep in mind that the new design should be scalable for a large dataset.
We went through 6 rounds of iterations and finally achieved what we wanted on the home page, which is a design that tells users how big the data set is but at the same time not overwhelming the user if the data set grows larger.

Mobile
Inspo
During the Ideation process we had the chance to find some inspiration for some of our sketches. We felt that for the map to be successful it would have to be interactive and that’s where I focused our energy.
Testing, testing…..123…
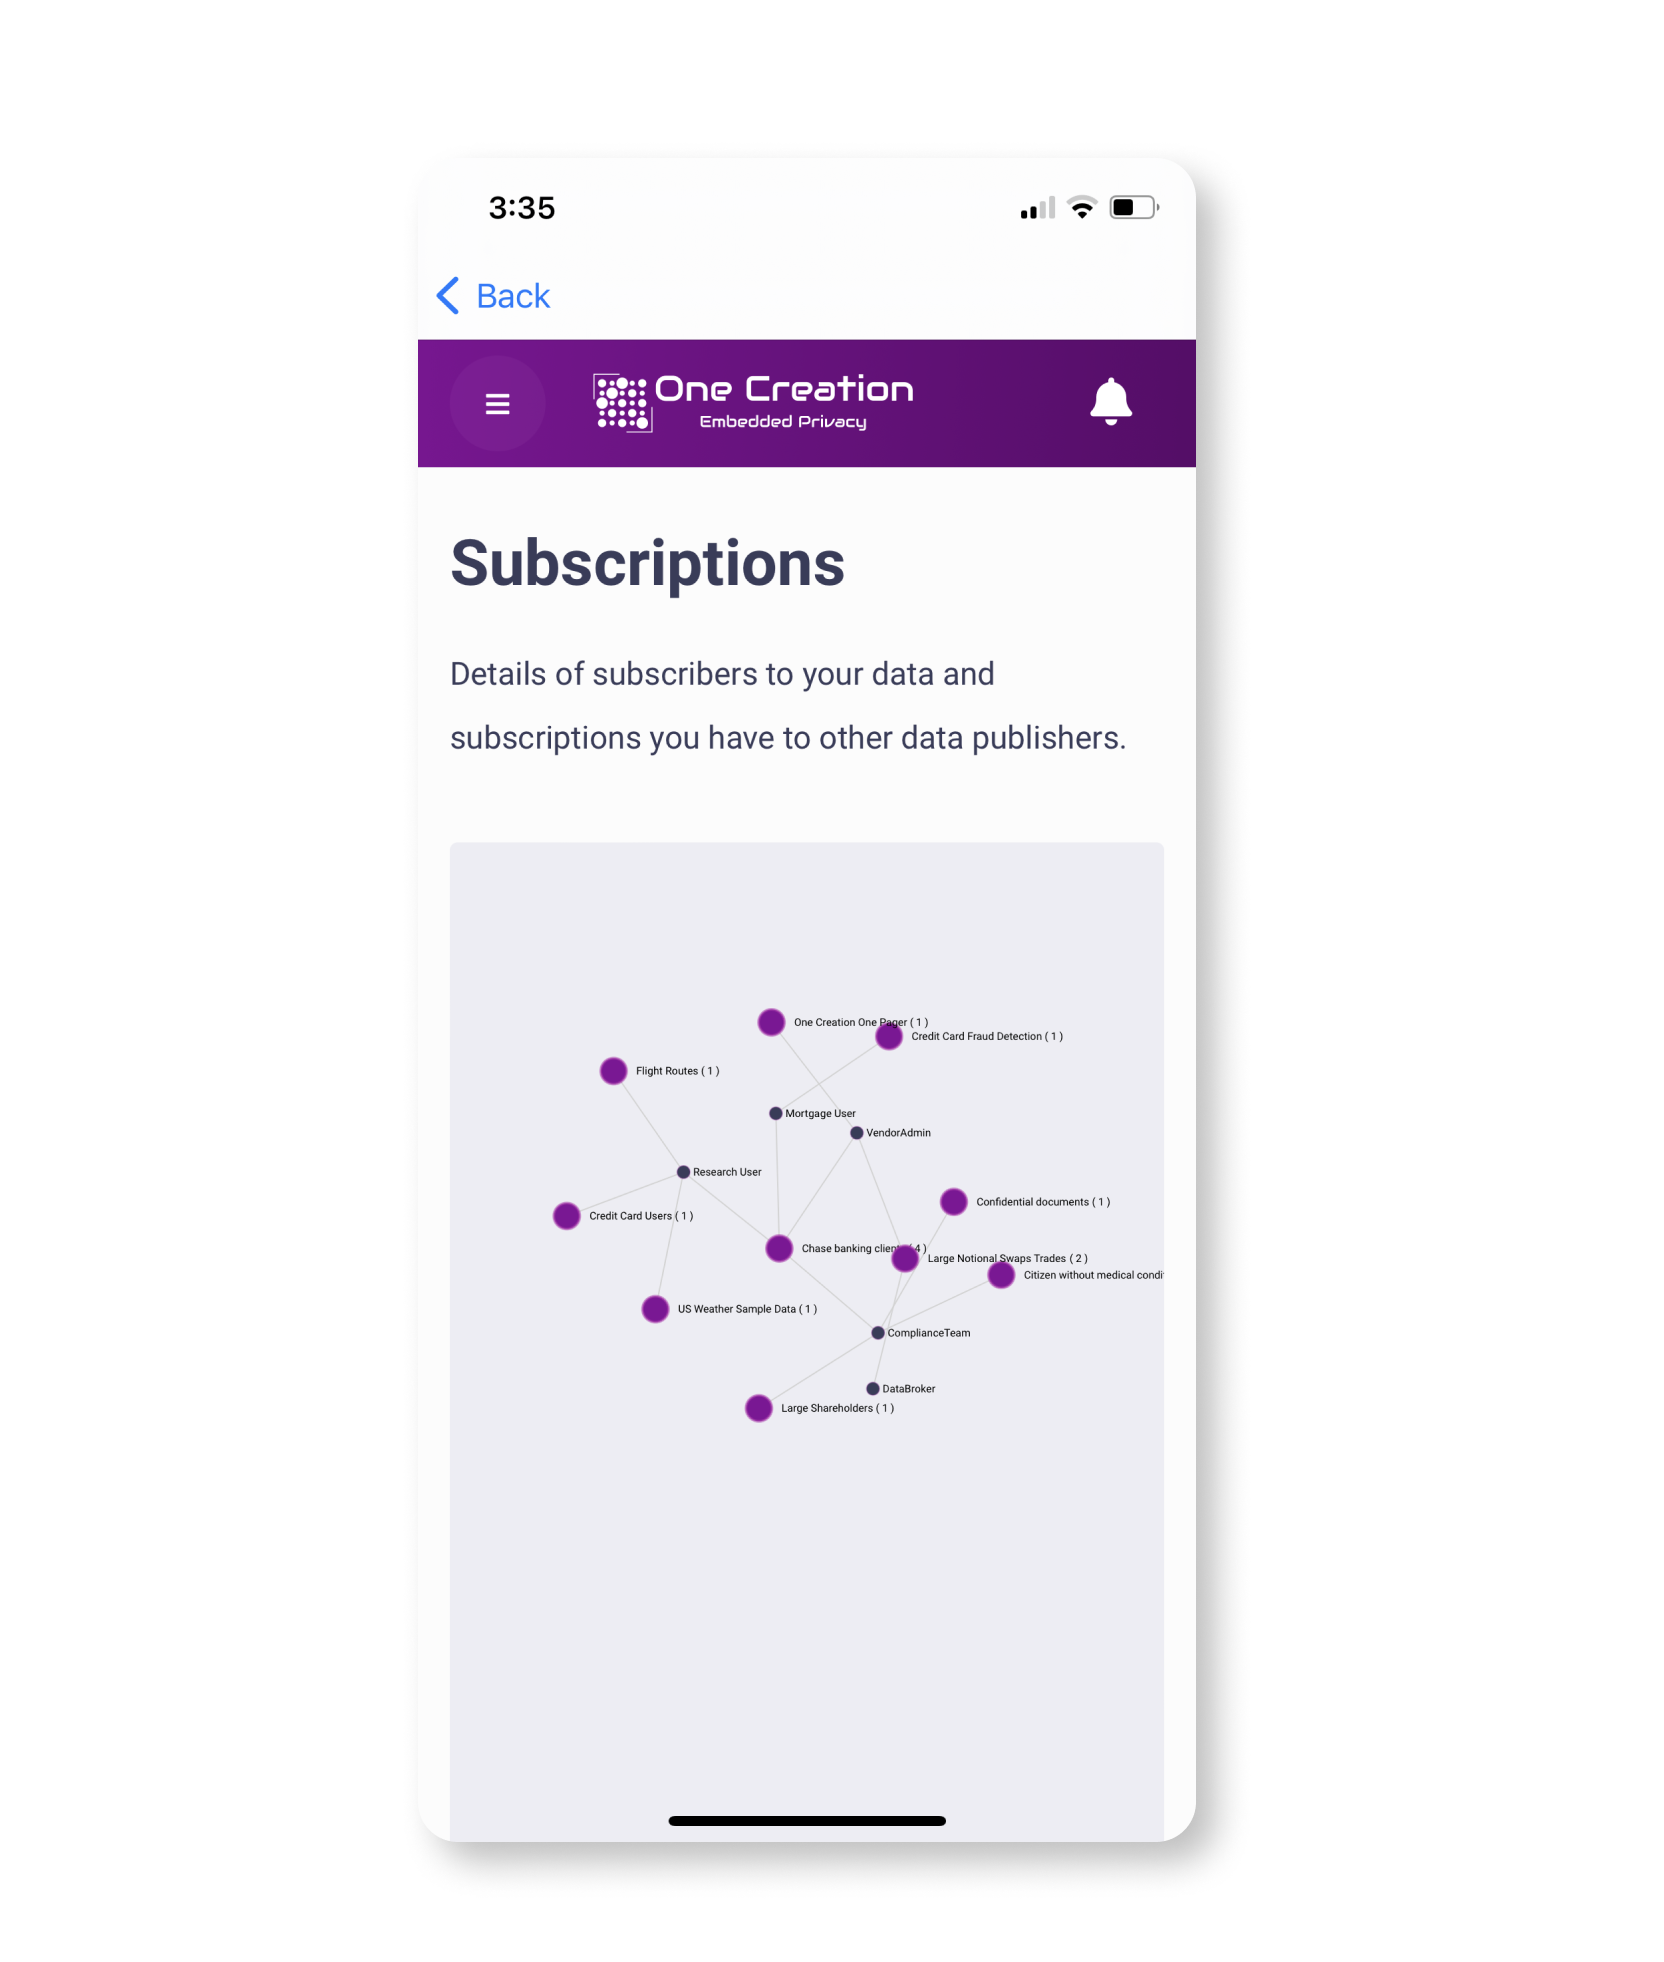
On to usability testing! We gave the product to 3 different users and asked them to complete some tasks. Initially we did testing on the original map and all of our feedback pointed to the map being confusing and that there was too much going on in one screen. It was even more confusing on a mobile platform because it was just a tiny version of the desktop map! How could users possibly fathom that!?
Therefore it was our mission to make the new design as pleasing and easy to use as data could possibly be to someone who had no prior experience!
Desktop
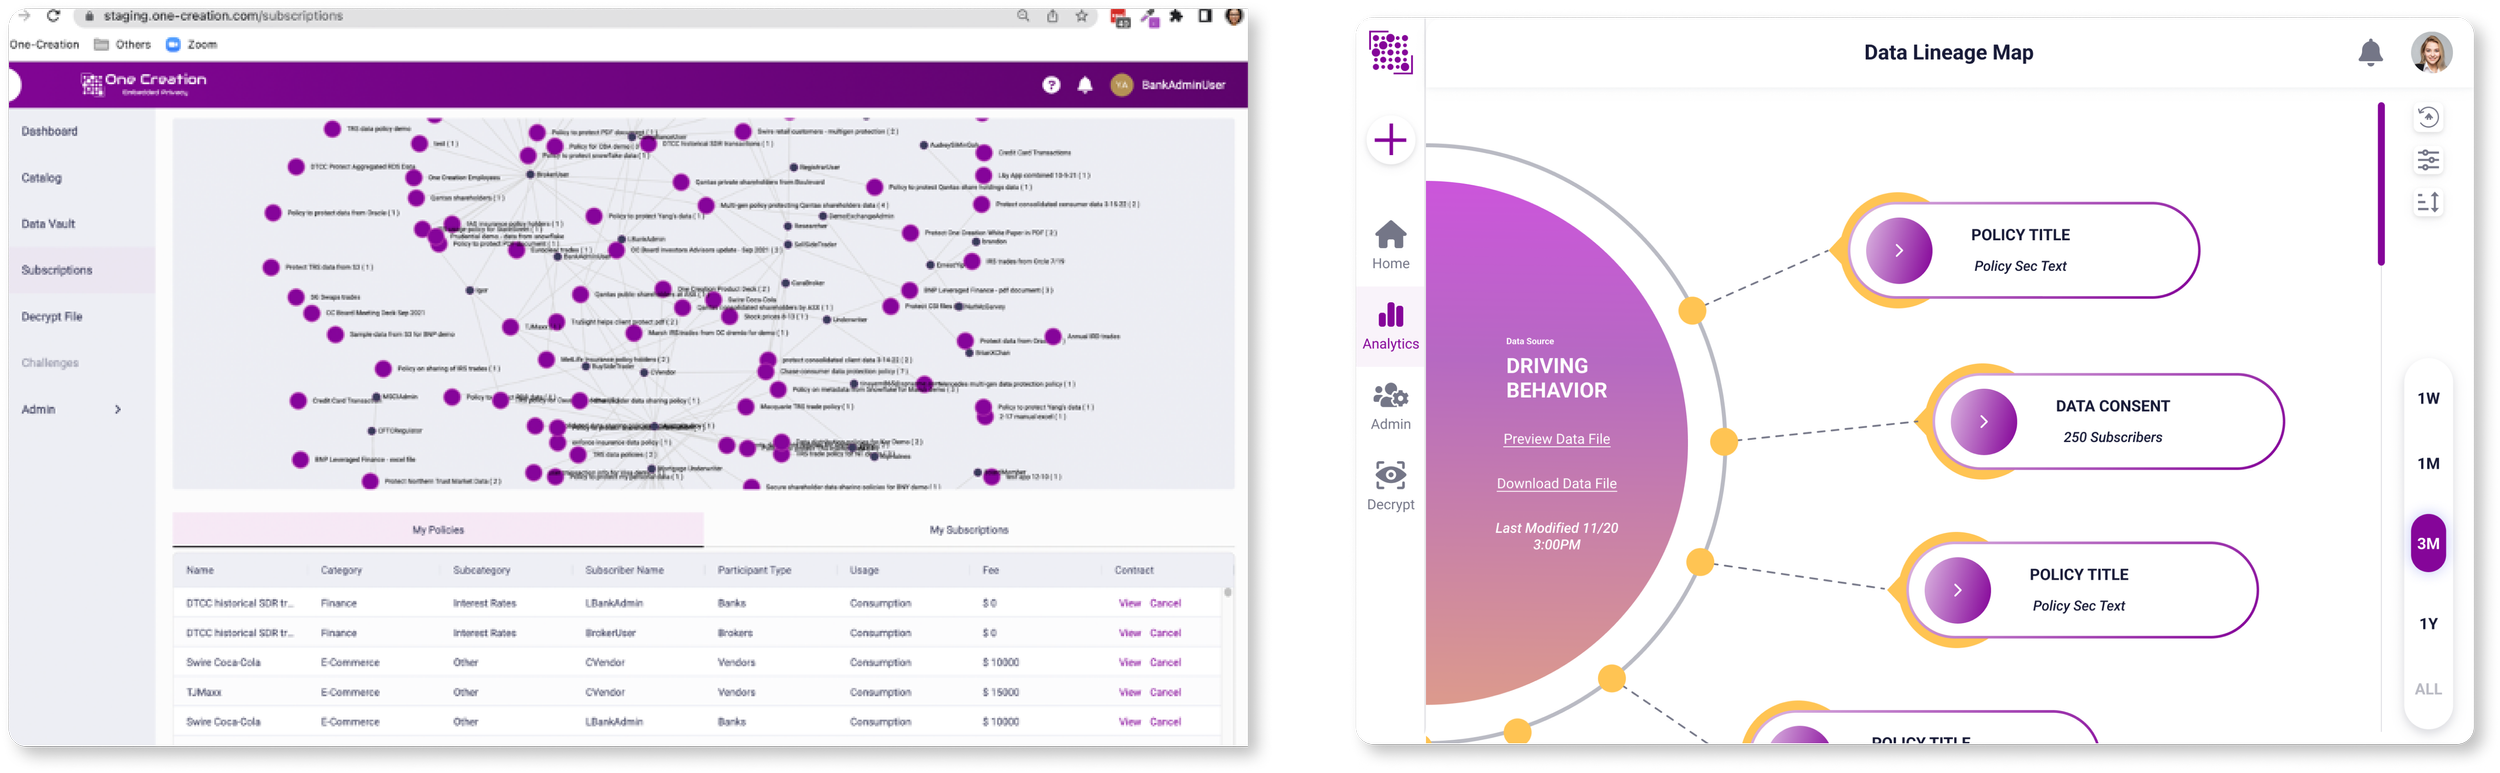
before
MOBILE
after

Before
After
New map: 3/3 users found the new update more intuitive and visually pleasing. However they did say they still did not know what each element represented. For this problem, we decided to present a tutorial feature that would help users identify the elements.
Next steps…
Our usability testing suggested that a tutorial feature would be useful, however, we did not have enough time to implement this.
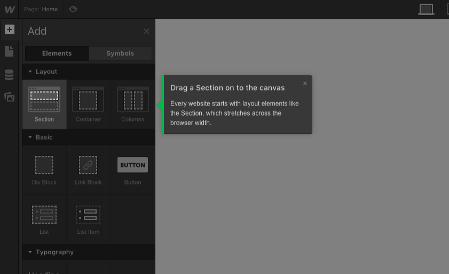
Webflow is great example of how we could implement a step by step guide for users who are not familiar with the software and terms.
This would be a tutorial for what each component means, so a pop up over each element that explains it. This could be a legend or an ‘i’ for information or a ‘?’, we feel this is a must have in the future because it helps any user use the map from the get go and clears any confusion they may have.
To do this, Material design has a great example of a react popover component and this is how we invision our design to be used. This would really streamline the collaboration between designers and developers, and would help teams quickly build beautiful products.
Testimonials
“We have a complex platform. For both teams, the concept is very hard to grasp.
It didn’t take the team long to understand. They asked thorough and great questions. This design is so innovative. This is a big surprise to us. We really like it!”
“Great job. Cannot thank you more. Great job with design itself, but for also how you explain our concepts that aren’t easy to understand.”
“React components with material design. This is the analog. PANIC AND FEAR. what am I supposed to do with this? They managed to sound excited and were methodical without sounding boring. The shoe finally dropped! This is how we are shifting the metaphor and what we are using to make this easier and more readable.”
Other Projects
Lets talk!
Want to make magic together? Say hello here